- GLUCUBE measurement record
- Manual measurement record
- Insulin record
- Medication record
- Sport record
- Food record
All these records can be viewed through the App in two ways:
Viewing records using the logbook
Access to the logbook is via the "Record" button below.
|
Once you access the logbook, you can view all of a user's records on a list. This list can be filtered by day, so you can access any record obtained on a date other than the current one.
|
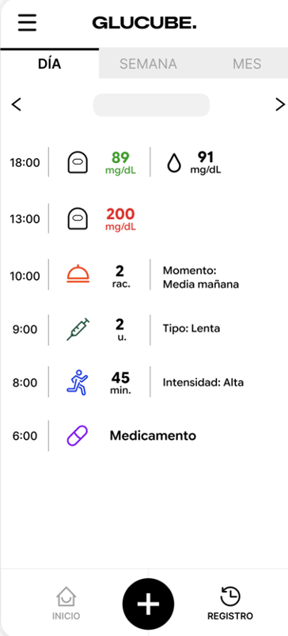 |
By default, the date that will appear will be the current day. If you want to see previous records, you should click on the date and select the desired date or move the date forward or backward using the arrows.
Viewing records using the graphics
The records can be viewed graphically through the main screen of the GLUCUBE application. You can configure the display of the measurements made with a filter, selecting a specific date using the calendar icon .
As in the logbook, you can select between the different options depending on the records you want to view:
- Day: Allows you to view the graph with the records of the day you have indicated
- Week: Allows you to view the graph with the GLUCUBE measurements of the week you have indicated
- Month: Allows you to view the graph with the GLUCUBE measurements of the month you have indicated
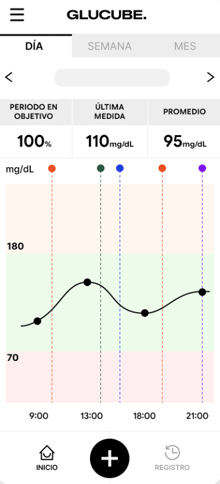
You will be able to view:
- The average of the GLUCUBE measurements made
- The value of the last GLUCUBE measurement made
- The target period of the GLUCUBE measurements made, which is the percentage of GLCUCUBE measurements made that are within the established glucose range
Daily graphic
In the daily graph you can also view the different records saved in graphic form, including those of sport, medication, insulin and food, as well as manual measurements.
The period in blue is comprised of the minimum and maximum values of the glucose ranges established in the profile configuration.
Each of the points represented in the graph will be the values of the different GLUCUBE measurements carried out over the period of time that we are viewing in the graph.
Weekly and monthly chart
In these charts you can visualize the averages of the weekly and monthly GLUCUBE measurements. In this chart, for each day that has GLUCUBE measurements recorded, you can see a point with the value of the average of the GLUCUBE measurements made for that day.
In addition, the minimum and maximum values obtained for each day will be represented with a blue shading, in this way you can better monitor the evolution of the measurements.